Positions
Shown when: always. This is where cells actually get coordinates.
The shape of it
Three regions: a Plotters strip along the top-left, a Cell Types list with placement controls below it, and a live plot on the right.
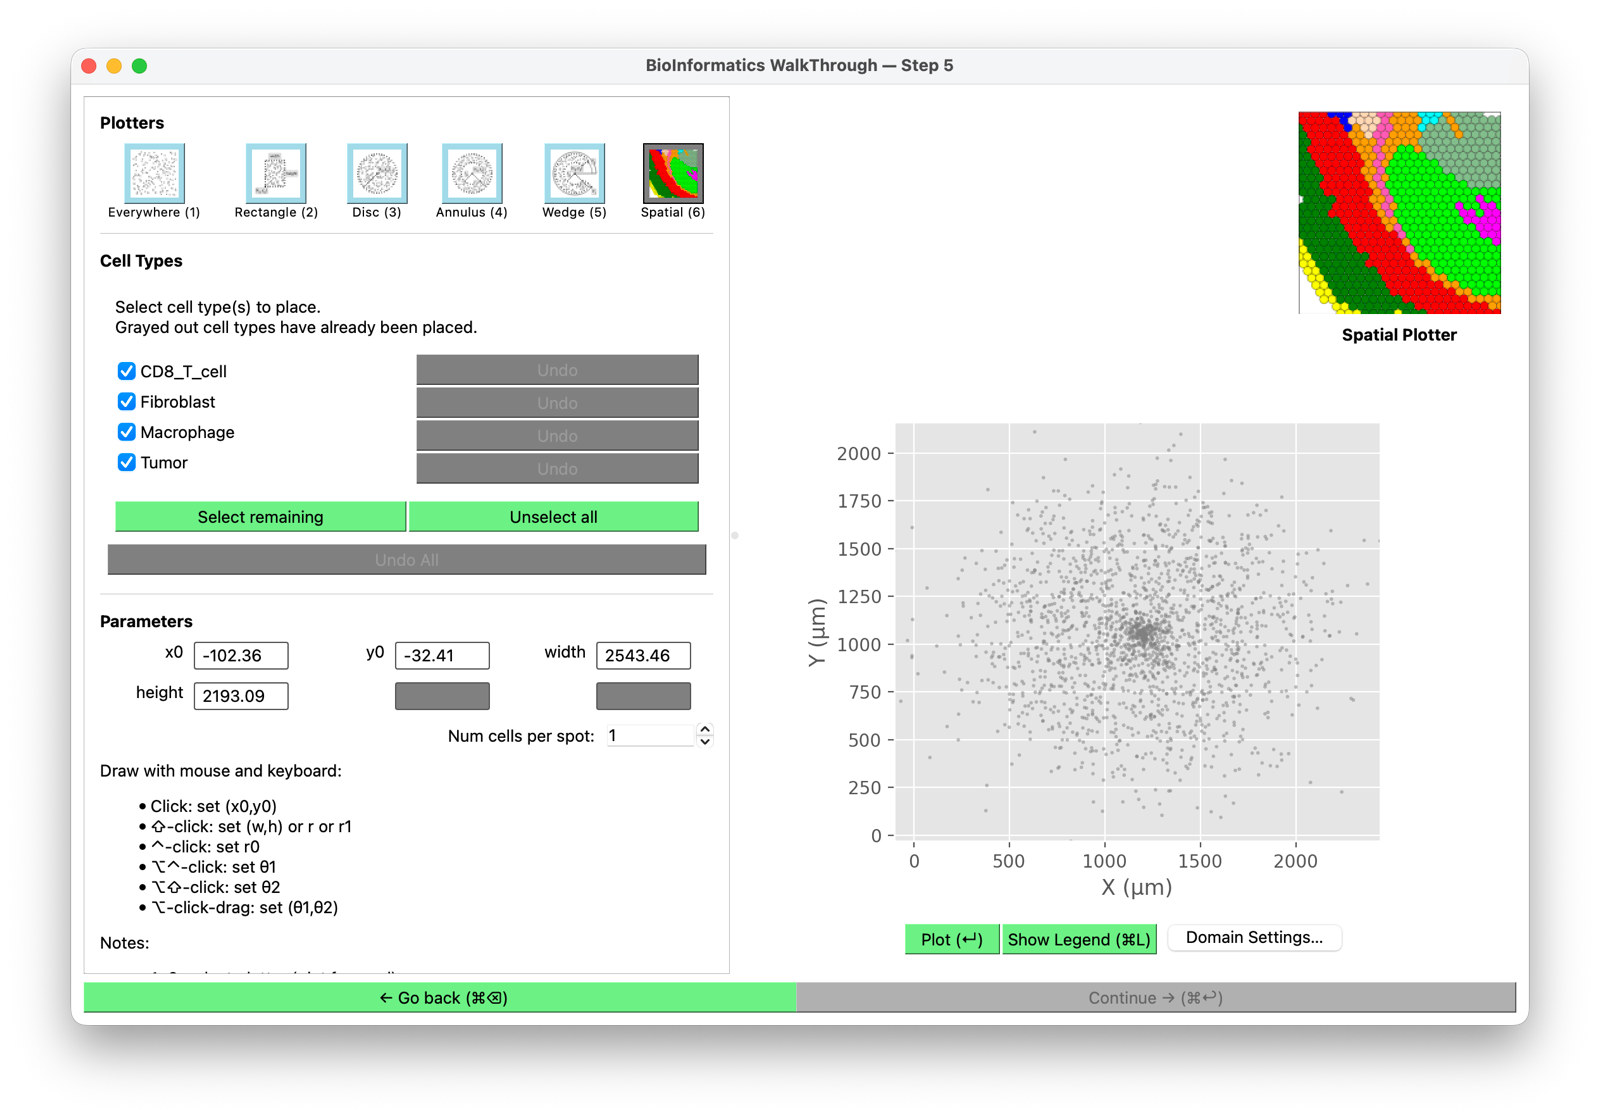
Placing is a deliberate action, not something that happens on arrival:
- Tick the cell types you want to place — or Select remaining for everything not yet placed.
- Choose a plotter (below) and set its parameters, by typing numbers or by drawing on the plot.
- Click Plot (↵).
The ticked types are placed, their rows gray out with "already been placed", their Undo buttons light up, and the plot redraws them colored by type. Continue becomes available.
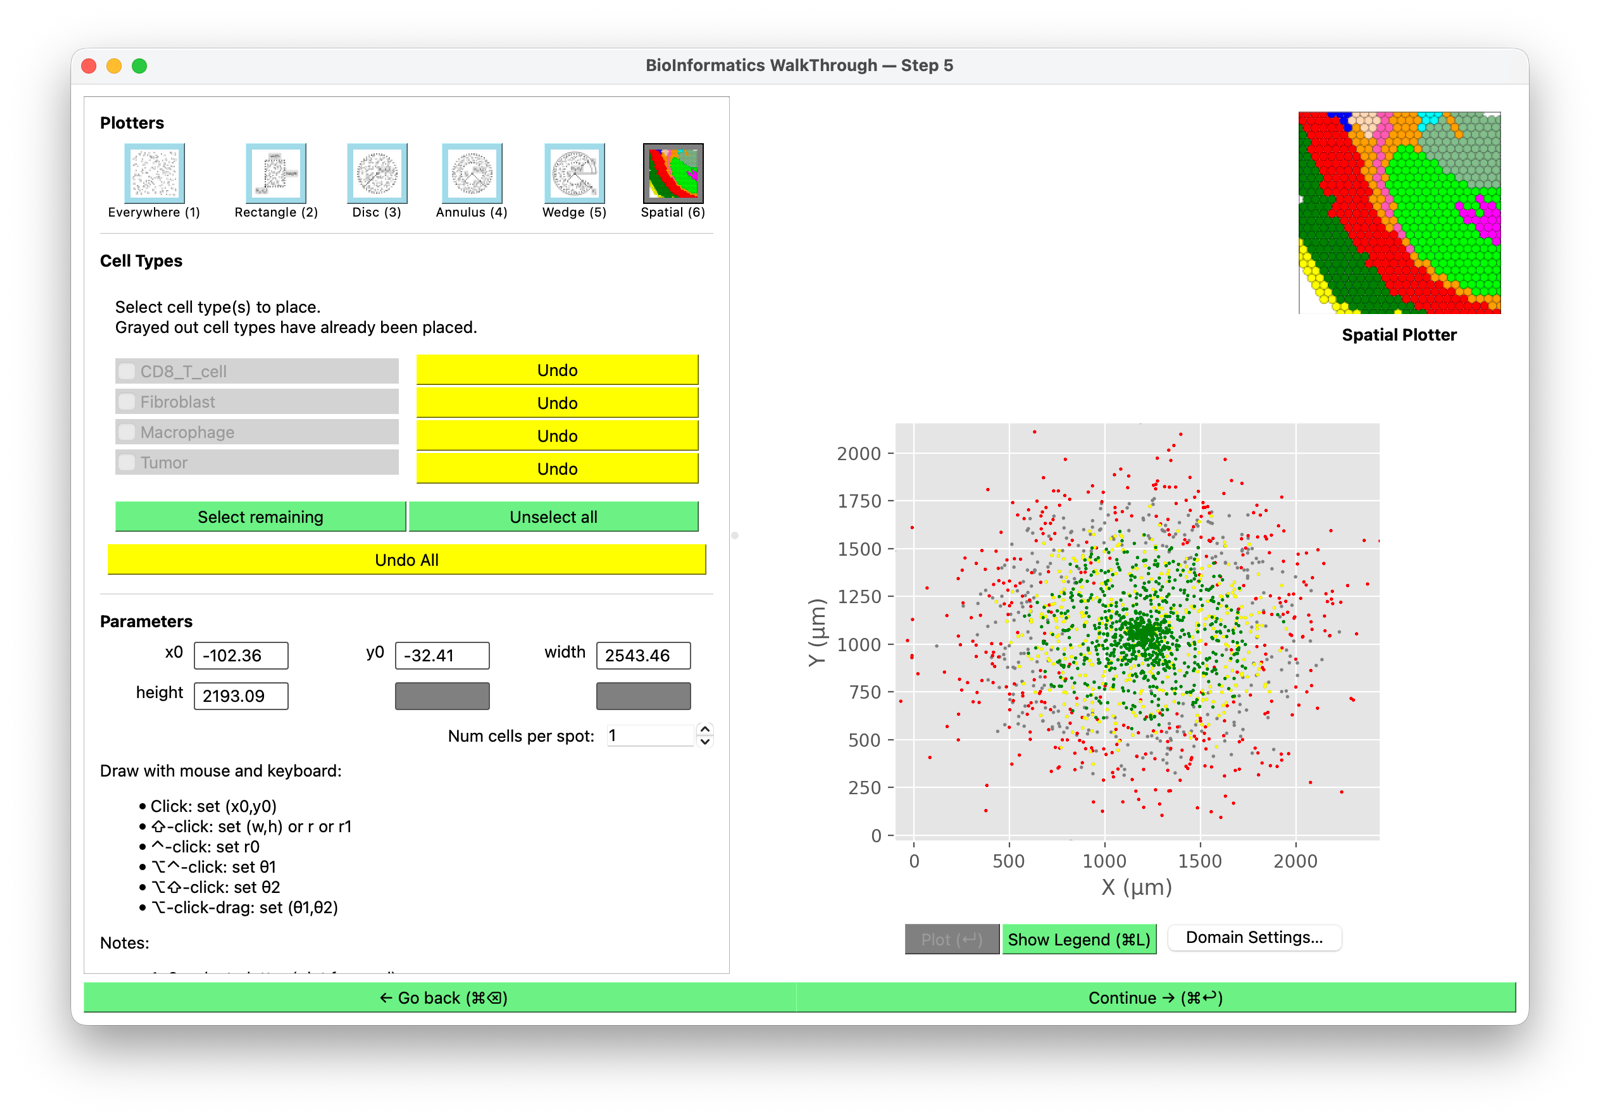
The plotters
Six ways to decide where the selected cells go. Three of them are named for the shape they make, so they are renamed when the domain is 3-D:
| Plotter | 2-D | 3-D | Places cells… |
|---|---|---|---|
| (1) | Everywhere | Everywhere | Randomly across the whole domain |
| (2) | Rectangle | Box | Randomly within a rectangle/box you specify |
| (3) | Disc | Sphere | Randomly within a circle/sphere |
| (4) | Annulus | Spherical Shell | Between an inner and an outer radius |
| (5) | Wedge | Wedge | Within an angular sector |
| (6) | Spatial | Spatial | At the coordinates from your data |
The number is the keyboard shortcut. Wedge keeps its name in 3-D even though it becomes a spherical sector, and the toolbar icons stay flat in both cases — the "Box" button shows a rectangle.
Spatial is the one that uses your file's geometry; the other five are synthetic regions you define, so this screen is useful even for non-spatial data.
In a 3-D domain
There is no 2-D/3-D switch. BIWT decides from the domain's z extent: 3-D means
zmax - zmin greater than 20 µm, one default PhysiCell voxel. The stock domain is ±10 µm in
z, exactly 20, so it is 2-D — you get a 3-D screen only after widening z in
the domain editor, and doing so mid-session rebuilds the plot in place.
Each shape then gains the parameters it needs: every one gets a z0, Box adds depth,
and Wedge adds a second pair of angles ϕ1, ϕ2 (defaulting to 0° and 45°, and accepted
only in 0–180°) alongside θ1, θ2.
Setting a region
The Parameters box holds the numbers for the active plotter — x0, y0, width,
height for a rectangle, radii and angles for the disc/annulus/wedge. Type them directly, or
draw on the plot:
- Click — set
(x0, y0) - ⇧-click — set
(w, h), orr/r1 - ^-click — set
r0 - ⌥^-click / ⌥⇧-click — set
θ1/θ2 - ⌥-click-drag — set
θ1, θ2together
Drawing is available per plotter, not everywhere. In a 3-D domain, Box, Sphere, Spherical Shell and Wedge are keyboard-entry only — type the numbers. Spatial keeps its mouse handling in both 2-D and 3-D.
Num cells per spot
Places more than one cell at each coordinate. Mainly for spot-based data where one row represents a patch of tissue containing several cells — see spot deconvolution for the case where the mixture is known per spot.
The extra cells are scattered in a disc around the recorded coordinate, in the z = 0 plane — including in a 3-D domain, where they will not be spread through the depth.
How spatial placement transforms your data
When the Spatial plotter is used, coordinates are transformed by a uniform scale and a translation — nothing else:
- Coordinates are multiplied by the effective scale factor (see the domain editor).
- The resulting bounding box is centered in the domain.
Because the scale is uniform, aspect ratio is always preserved.
The cells may not fill the domain
If your data's aspect ratio differs from the domain's, the cells occupy a correctly-proportioned region inside it rather than stretching to the edges.
Resizing the domain changes the container, not the cell scale. To change how large the cells are relative to the domain, change the scale factor.
The domain editor may open on its own
The first time this screen appears, BIWT compares your data's extent to the domain and opens the domain editor if the fit looks wrong in one of two ways:
- outside — some cells fall beyond the domain boundary and would be excluded
- small — the cells fit but cover less than half of an axis or half the area, so they would sit as a small island in a large empty box
It opens once. Dismissing it settles the question for that run, and navigating back and forward does not re-trigger it. Reopen it any time with Domain Settings….
Undo
Undo per cell type, or Undo All. Domain changes are undoable too: changing the domain recomputes the default placement while preserving any manual edit as an undo step.
Out-of-bounds cells
If cells end up outside the domain, BIWT warns and offers to either clear the placement or keep it. Keeping them is legitimate — some hosts cull out-of-bounds cells, some clamp them.