Import data
The first screen has one button: Import file…. It offers .h5ad, .rds, .rda,
.rdata, and .csv.
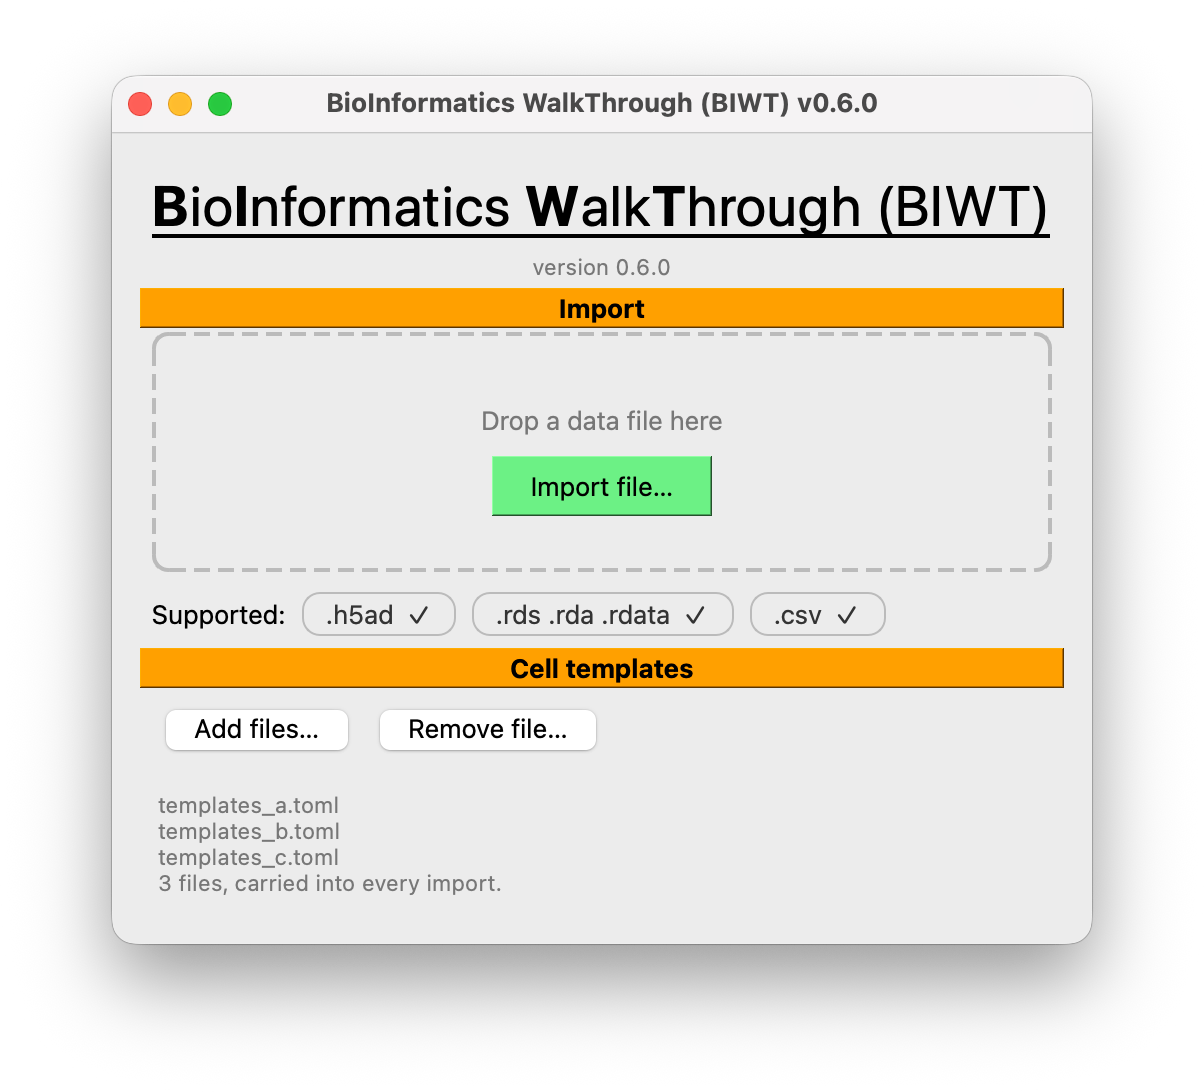
Cell templates
This list is the template library every import starts from. Add files… puts a file on it; Remove file… takes one off. Your host's own files seed it, as ordinary entries — remove one you do not want and it is gone for good.
The files are only named here; they are read at the cell-templates step, so a file that cannot be read is reported there.
What BIWT reads from each format
| Format | Read via | Supported objects |
|---|---|---|
.h5ad |
anndata.read_h5ad |
AnnData |
.rds |
rpy2 + anndata2ri |
Seurat, SingleCellExperiment, SpatialExperiment, SummarizedExperiment |
.rda / .rdata |
base::load() in R |
Same, as the first object in the workspace |
.csv |
pandas.read_csv |
A flat table, one row per cell |
Whatever the source, BIWT normalizes it to the same internal shape: a table of per-cell
metadata (obs), an optional array of spatial coordinates (obsm), and a cell count.
.rda / .rdata files with several objects
BIWT takes the first object in the workspace. If you saved several objects together, re-save just the one you want.
How spatial coordinates are found
BIWT looks for coordinates in two places, in order:
- An
obsmspatial array — the normal location for AnnData and SCE objects. - Columns in
obs— checked in priority order:x/y/z-style names first, then, as a last resort, the 10x Visium pixel columnsimagecolandimagerow.
The Visium fallback needs one adjustment: image rows increase downward, so imagerow is
flipped (y = rowmax − imagerow) to give a conventional y-up system. imagecol maps to x
directly.
When coordinates come from obs columns rather than an obsm array, BIWT synthesizes
obsm["spatial"] from them so the scatter plots on later screens have something to draw.
Coordinates found this way are in data units
BIWT reports the extent in a generic data unit and infers no unit name from your file.
Visium pixel coordinates in particular are not microns. Converting them is the job of the
scale factor in the domain editor — and Visium is the one case where BIWT
can read the factor (µm per pixel) out of the file and pre-fill it for you.
Probability columns
If your table has columns ending in _probability — for example T_cell_probability,
Tumor_probability — BIWT recognizes them as per-spot cell-type probabilities. Combined with
spatial coordinates, that unlocks the
spot deconvolution step.
Re-importing
Importing a second file resets the whole session. Every choice you made about the previous file — cluster column, merges, renames, counts, positions — is discarded. There is no partial carry-over.
When import fails
The error dialog tells you what failed and why. Failures fall into two groups:
Something is wrong with the file. Unsupported extension, malformed CSV, an R object of a class BIWT does not handle, an empty R workspace. Fix the file.
Something is wrong with your environment. A missing optional dependency, or an R stack that cannot load your object. These dialogs carry a link to the setup instructions, because that is where the fix is:
anndata is required for .h5ad files→ installbiwt[anndata]rpy2 and anndata2ri are required for R files→ installbiwt[seurat]and an R stack (recipe)anndata2ri activation failed→ you haveanndata2ri2.0+; pin it below 2Failed to read … as R object→ usuallySeuratObjectmissing from the R thatrpy2bound to, or an ABI-mismatched R (troubleshooting)
A failed import leaves you on the import screen with nothing loaded, so you can fix the problem and try again without restarting.
Next
Spot deconvolution → if your data has probability columns and coordinates; otherwise cluster column →.